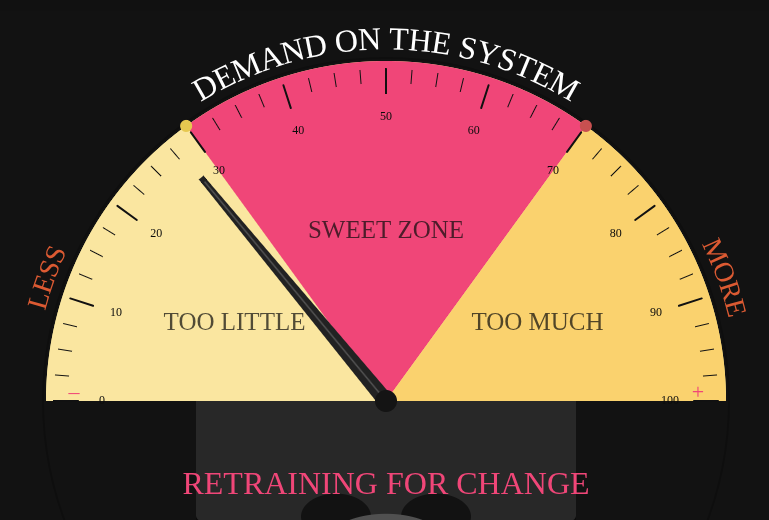
A vintage VU-style half-moon meter for visualising the therapeutic sweet zone between too little and too much demand. The arc label is editable — adapt it to any patient context in real time. Drag the boundary handles to adjust zone widths, and use the needle to show the current position.
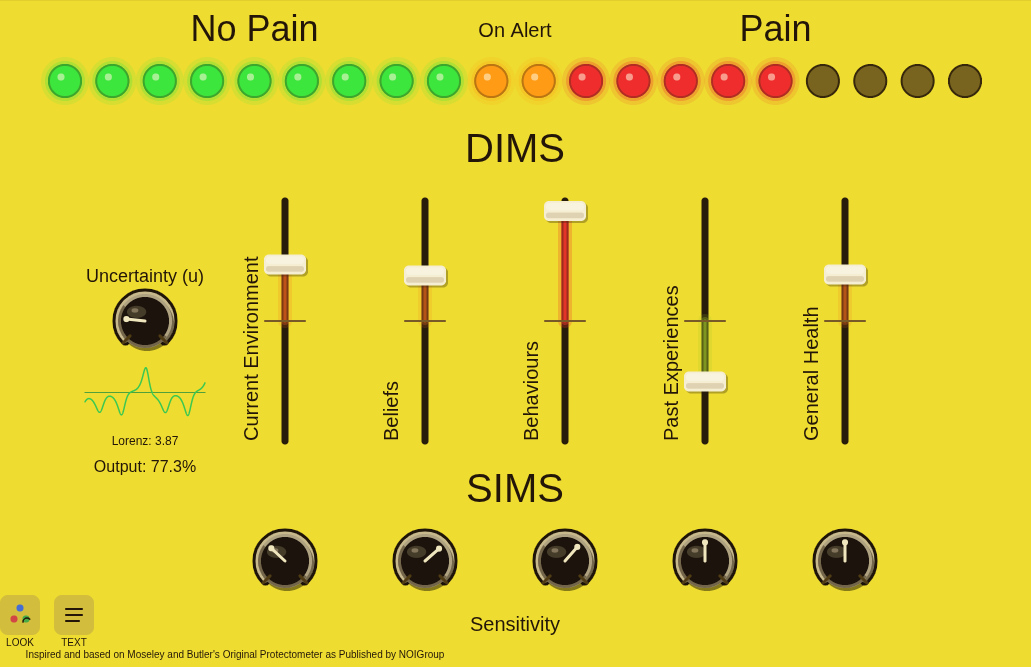
An interactive pain sensitivity meter based on Moseley and Butler's Protectometer model. Five sliders represent contributing factors, combined with a Lorenz attractor system to model dynamic sensitivity. Supports multiple presets (Pain, Anxiety, Fatigue, PTSD) and two visual themes. All labels are editable.
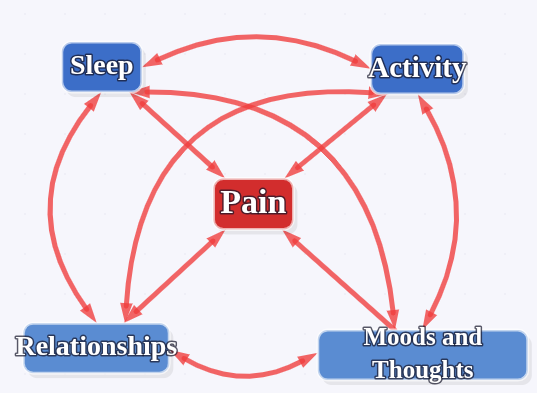
This tool helps you and your clinician build a personal map of your pain journey — showing how different parts of your life connect and influence each other. The Analyse feature shows how changes in one area might ripple through the rest of your network, helping explain why pain can feel so unpredictable. The numbers are a simplified model, not a medical measurement — use this as a conversation starter, not a diagnosis.